Trend following is all about following the price. Typically the only input we need for a trend following model is the price. But what if I told that we could make a kind of trend following model which does not use the price direction as an input at all? It also has no stops and no targets.
In this article, I’d like to introduce you to a different way of thinking about futures trading models. It may sound a little strange at first, but I can assure you that it’s perfectly logical. What we’ll be doing is constructing a model that uses only the implied yield of the term structure. No, that’s not as complicated as it sounds. In fact, it’s something that you really should understand if you trade futures.
Let’s start with a quick recap of what term structure means. It’s really quite important and you shouldn’t be trading futures if you don’t understand that part.
If you for instance want to buy gold futures, you’ll need to pick a specific delivery. As of writing this, you could trade the December 2016, February 2017, April 2017 etc. Which months are available varies for different markets. There is usually one delivery month which is by far the most liquid one, and that’s usually where almost all futures traders have their positions. Right now, the primary month just shifted from December 2016 (Z6) to February 2017 (F7).
Looking at the usual futures chain, in most market data systems it would look something like this image below. The chain will show you what deliveries are listed and the key data for them.
What is important to understand here is that the price for two different deliveries of the same market will always be different. Sure, gold is gold, but we’re not trading actual gold bars here. We’re trading a contract that requires a delivery of gold at some point in the future. How far in the future this point is, will be a factor in pricing that contract.
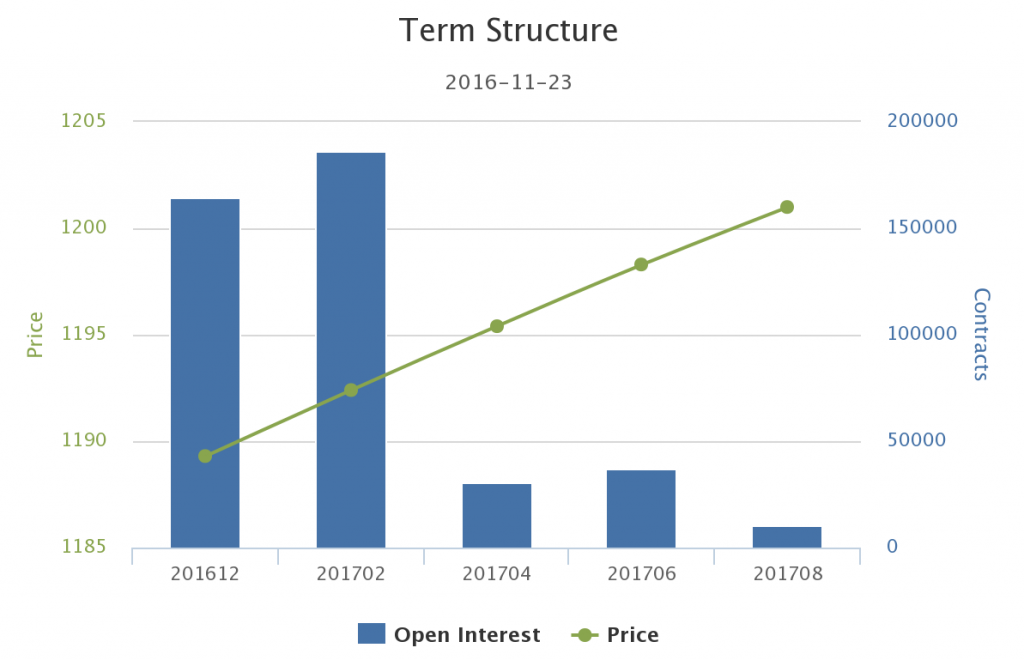
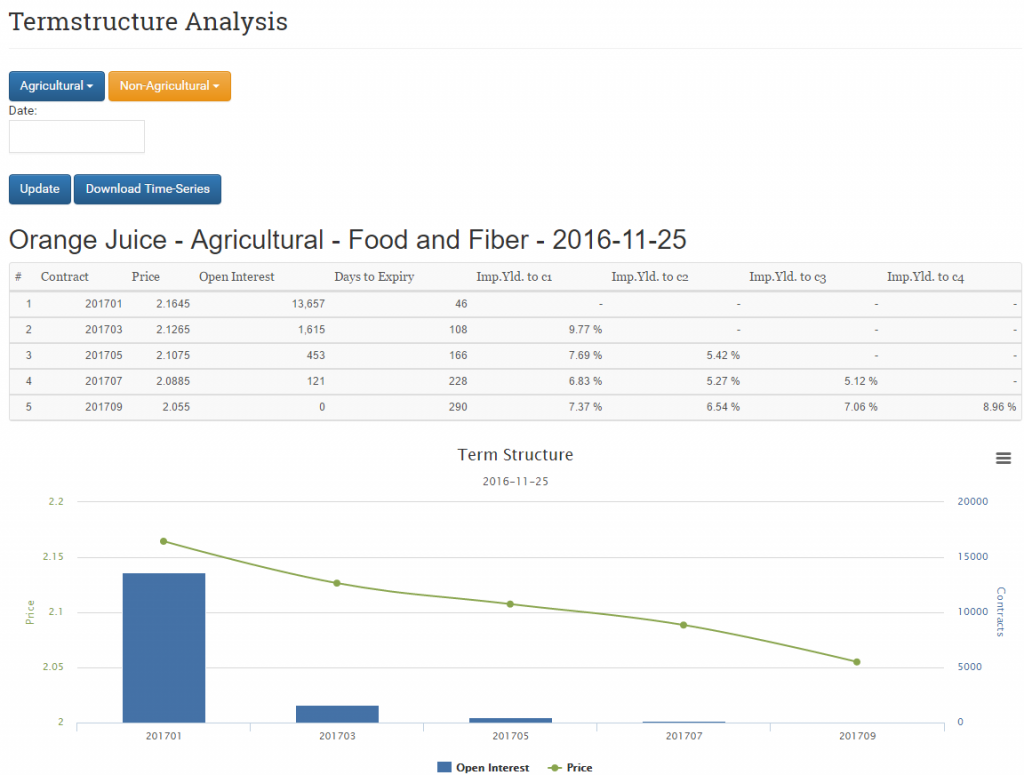
The graph below shows this relationship. The green dots, connected by a line, shows the price for the different deliveries. As you can see, gold is currently cheaper for a December delivery than for the later deliveries. This is what’s called contango.
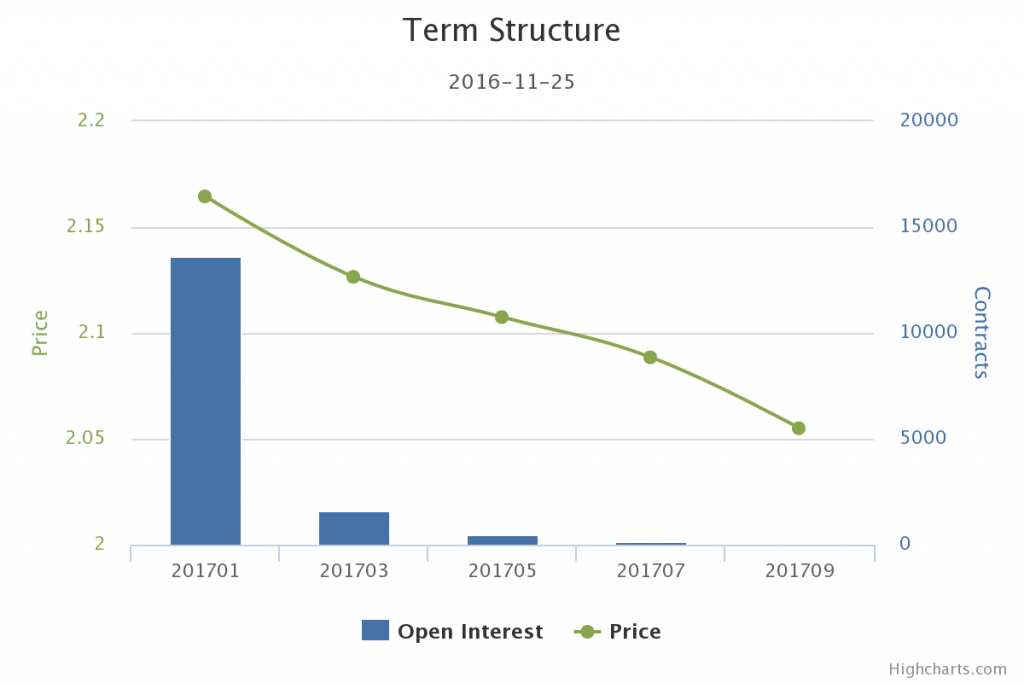
If the prices are lower further out in the future, that would be called backwardation. In the example below, you see the term structure graph for orange juice. Note how the green price markets are lower and lower for each successive delivery. This is because this market is in backwardation.
There are several factors at play in the price differences. Interest rates, storage costs etc. For financial futures, like equity index futures or currency futures, the price difference is minor. For commodities and fixed income, the difference tends to be more significant.
So far, none of this should be new to you. If you trade futures or have in interest in the subject, this is all old news. After all, this is the reason why we need to adjust futures continuations.
Now if you understand the logic so far, you should also understand that the term structure impacts the direction of the price. No, no, that’s not at all a stretch of the logic. Here’s how to think about it.
In this example, the price of spot gold is now exactly $1,000. The February futures contract is trading at $1,020. We know that by the very definition, the futures price will at expiry settle at the same price as the spot market. From the above, you should understand why the price might be a little different in the futures. But here’s the kicker: If the actual futures price does not move at all, and stays at exactly $1,000 the entire time, the price of the futures contract has to, by mathematical certainty, fall $20 until it goes to delivery.
Below is a chart that someone who seems to have the same level of artistic skills as I do has contributed to Wikipedia. The logic shown here is correct, but I can’t help but think that the label “Expected future spot” is both incorrect and misleading. It would be more clear if it just said “Spot”. Also, this graph has the word forward in the labels, but the logic is exactly the same for futures.

Ok, are you with me so far? What did we learn here that is of real value?
We learnt that a market in contango has a bearish bias and a market in backwardation has a bullish bias. Now we’re getting to the juicy parts.
This of course doesn’t mean that a market in contango is always falling. It is very much dependent on the price movements of the underlying asset, but it does put a bias on the price. A market in contango will need to see a price increase in the underlying just for the futures contract to remain flat. It can be a powerful driver of long term market moves if the term structure is steep enough.
For some markets, the term structure is so steep and so persistent over time, that it’s really all that matters. This is the situation we had for so many years in natural gas, and something that is very clearly visible in STIR markets.
A couple of paragraphs ago, I threw out the phrase “if the term structure is steep enough”. That begs the question about how you could measure the steepness. If you have a background in finance, you already know the logical answer. Calculate an implied annual yield!
Simple stuff, people. Take the price difference between two contracts. Calculate the percentage difference. Check how many days difference there is in the two deliveries. Now use that to annualize the difference to standard money market yield conventions. And now you have a number that you can relate to and compare across all markets. It tells you the implied annual yield between two points in the term structure.
Is this information useful?
Let’s find out. Let’s build a model that only uses this information. Nothing else. We’ll just trade on the shape of the term structure.
The only indicator we use is a time series of the implied yield between the active contract and the next. We’re just looking one point out in this simple example. Nothing fancy, we just want to see if there’s any informational value to this.
The rules are very simple. If the implied yield between the second and first contract is more than 3%, we go long. If it’s below -3%, we’ll go short. Allocation is standard volatility parity and these rules are applies on a large set of futures markets, covering agricultural commodities, metals, energies, fixed income and STIRs.
Keep in mind that this is a highly simplistic demo model. It’s not meant for live trading but it is something that holds a great educational value.
The results?
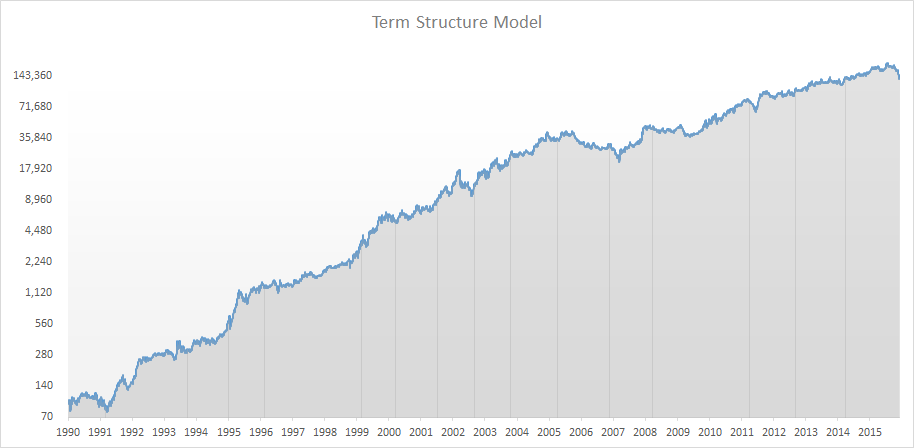
A simulation starting in 1990 saw an annual return of 30.7% with a maximum drawdown of 50%. Not bad for a model as simple as this. Did I pick some over optimized settings? No, not really. Let’s change the number up a bit. Let’s run it again, and set the yield threshold at 10% instead of 3%. Just to make an extreme change and see if we break the logic.
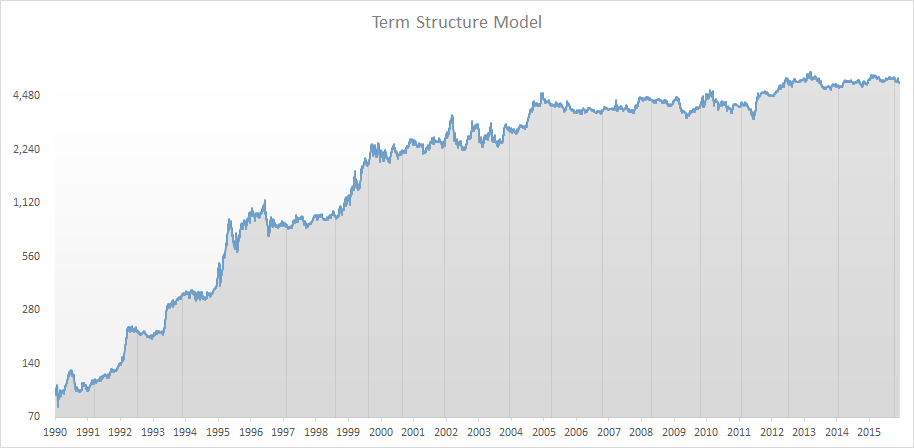
Now we get an annualized yield of 16%, at a max drawdown of 38%. Note how most of the return was made in the 90’s, with returns leveling out a bit in the past decade. That’s not too strange, given the change in interest rate climate. Yes, that means that you may want to model different thresholds based on the yield situation at the time, but there you need to do your own homework. I just want to get your interest in the idea here.
What we can see here is that seemingly crazy rules like this, actually has a clear value. Now again, no one in their right mind would launch a model in this shape, but now we know that there is a value to be found in the implied yield.
By standardizing the term structure shape into what resembles an indicator, you have a easily accessible way to base models on this data. There are plenty of more things you can do with this information of course. This is just a simple demo to show the value.
Getting the Data
So why isn’t everyone using this data as an input factor? Well, a lot of people do. But not on the retail side. It’s really not that hard to get this data, but it may require a little more work than just punching up a chart on a website.
All the data you need is actually available for free, if you’re willing to do the work yourself. You need end of day time series for the currently trading contracts as well as data on price, expiration dates and preferably some data on volume and open interest. This is all available from the exchanges for free. Now you just need to crunch the data and automate the process.
Once you have the time series for the implied yield, you can put that into your simulation platform and start developing models. In this article, I made a simple demo model that only uses the structure as input. You might also want to construct models that use the structure as one of several inputs.
I’ve already automated this process of course, and it’s available on this site. You can check the implied yield between different points and download a full time series history that can be imported into your simulation platform.
The automated daily data is currently only available to subscribers of course. Sorry about that. But that seems reasonable, I think, given that I actually explain above how you can do it yourself. I will write more on this topic going forward and I plan to publish some sample model code in the premium section as well for making use of the term structure data. Feel free to sign up and give it a spin.
I’m also trying out this article as a bit of an experiment. In my own view, this is likely one of the most useful and valuable articles on this site. But I also suspect it will be one of the least read. It’s a funny internet phenomenon, I suppose. If I write an article about how Elliot Waves are for people who believe in chem trails, I get 100,000 people reading it even though it’s just really obvious stuff. Usually when I actually write something of value, very few people read it. Let’s see what happens to this one. If there’s a real interest, there’ll be more useful articles. Otherwise, I’ll go back to picking on the mathematically challenged…
 Following the Trend






I read it! great article! Its your writing style which makes things interesting to read and follow. I was just thinking a few weeks ago about how you had not published new content. Looking forward to the insight you have to offer in 2017.
My signals are all on for new material coming from you Andreas, so I read it! Crystal clear, sheds light on contango and backwardation which were still a bit misty for me.
Clear, lucid pointers that as usual are relevant to assessing markets.
Now at least three people have read it. ? this deserves a bookmark and second read. Thanks!
I read it. Great article but I miss chemtrail references. Anyway I learned this method first when trading volatility ETFs.
Great stuff Andreas – thank you. I’m guessing you used RightEdge to run the simulations described in your article but did you use RE to create the implied yield time series files. Seems like that would be difficult. Might be easier to create program separate from RE that works directly on CSI (or whatever) data files to create the time series and then give RE access to those files during simulation runs? Very curious as to how you did it. Thanks again. Greg
The yield series are actually created on the fly, in MySql. I put all individual contracts in the database. Yes, that’s a lot of them. Then all you need is a nifty little sql query that fetches the calculated implied yield time series the way you like them.
Then of course, I made an indicator in RightEdge which uses said SQL query, fetches the data and returns it in the shape of a regular indicator, and presto…
Hi Andreas, interesting article, I have a question:
I found it hard to conciliate:
“We learnt that a market in contango has a bearish bias and a market in backwardation has a bullish bias..”
And
“The rules are very simple. If the implied yield between the second and first contract is more than 3%, we go long. If it’s below -3%, we’ll go short.”
If I am interpreting it correctly, it says: if contango then long, if backwardation then short, but you mentioned the opposite above when talking about the bias.
Am I missing something?
Thanks
Have the same question. How is the implied yield of futures defined?
Andreas,
OK, I read the article. My immediate impression is that the concept is useful when deciding to enter the market, or not. In “Stock on the Move”, you call this an index filter, meaning, you open new positions only if the index is above its 200-day moving average.
Changing thoughts now… When can we expect to see trading strategies for retirees?
Add me to your sample set! Your experiment worked–but you still managed to click-bait me with a killer title. Also a shout-out to Robert Carver whose twitter feed also mentions the article. Haven’t seen much on portfolio management from your side. I’d be thrilled to read an article by you titled “Surely you must be joking, Mr. Markowitz?” or “How not to be an Ass at Asset Allocation”. Of course, I know ACIES does lots more than just invest in financial instruments (as you revealed to Niels Karlstrup Larsen) but it would be nice if it was just on allocating between Trend, Momentum, Counter-Trend and Mean Reversion strategies. I promise I will print the article on glossy paper and frame it my office–sheet by sheet! Seriously, it’s a strategic leak I need to plug. I deeply profit (financially and intellectually) from your work. Regards.
I use term structure trading VIX-based instruments and crude oil. I’ve always wondered how it would look like across other futures products and you’ve piqued my interest even more. Thanks!
Great article Andreas, I think from the retail perspective people may use software to roll futures into continuous contracts but not actually know the reason why. Much less that the curve may hold trade-able information. As with all of your posts, it is got a great insight, and a working example on how to get you thinking about this model. Very enjoyable read.
Andreas,
Thanks for the excellent article and I concur with your comment on the usefullness and value of the article. It’s rare to see an article that discusses the practical trading-related aspects of term structure.
A couple of questions:
You said “If the implied yield between the second and first contract is more than 3%, we go long. If it’s below -3%, we’ll go short.”
1) In this context when you say “we go long” do you mean go long the first contract or the second?
2) When you say first and second contract do you mean a) first=nearest and second=nearest+1 or b) first=some contract and second=another contract farther out on the curve
Thanks,
Robert
I realized that perhaps I didn’t explain properly, Robert. You’re absolutely right.
What I did was a very, very simplistic model. It’s not meant as a proper trading model, only to demonstrate the idea.
By first contract, I meant the currently most liquid. I.e. highest open interest. That ensures that we don’t bother with the closest expiry after it’s gone into delivery.
We check the yield between the highest OI contract the the contract that follows it. That’s the basis of the trading decision.
Then we trade the most liquid contract, the highest oi. Just like you would for most simple futures models.
Wait, what? Wouldn’t it make more sense to trade the second contract, since we’re basis our decisions on that? Yes, but then we’d get a more complex model than I wanted to do here. If we do that, we also need to model liquidity and the often loser spreads on the less traded contract.
Experienced futures analysts may also ask why I didn’t just calculate implied yield based on the cash market. Also a valid question, but again adding a level of complication that I wanted to avoid here. Most people reading this would find it a little difficult to get proper time series for that.
And then of course, you may want to look at using this kind of data for calendar spreads. Well, there are many applications really.
But for now, the only point I wanted to make is that it’s not too difficult to create these implied yield time series and there is a value to be found in even the most simplistic applications of it.
Great article Andreas – thank you for sharing it!
I’ve been looking at ways to model the term structure to look for changes over time, but it didn’t occur to me to use the implied yield as a “point in time” indicator of the near future structure. Have you looked at the volatility of the implied yield as you calculate it in your article? I believe it might give you a sense of the stability of the term structure. As an example, a high yield/low volatility situation would seem to indicate a stable market in strong contango. Then all you need is a trading strategy that works well in strongly contango markets.
Please keep the numerically based articles coming.
Hello Andreas,
As a spread trader I’m always on the lookout for indicators that might add to my bottom line re spreads.
It seems like the yield difference between any two intra-market contracts that I might want to consider for a calendar spread might at least give me an indication that as to which direction I should be looking to trade a given spread.
Also intersting might be looking at the yield difference between pairs to aid in pair selection. For example re soybeans, which among SH7-SK7, SH7-SN7, SN7-SX7 would be the best pair to trade.
Maybe the one with the largest yield differential greater than some threshold would be considered first … maybe.
An, interesting article. Thanks for sharing!
Hi Andreas,
Same as above, it is not clear for me either, if the concept is that contango has a bearish bias, why would we buy the contract in this system? (And the opposite for backwardation)
Thanks,
PS: Love your books
Andreas
Thanks for the excellent article.
I’ve come across the concept a few years back at http://www.automated-trading-system.com/better-trend-following-improved-roll-yield/ but I had no idea that term structure could be such an important return factor by itself. That link mentions indices and funds that try to optimize returns by taking into account the term structure roll yield. For example, total return on fund ticker DBC seems to outperform (non-roll-yield-optimized) fund ticker GSG and benchmark index IDCUSASS.
I trade a suite of two systems (one trend following and one mean reversion) but do not incorporate roll yield – a bit above my programming capabilities for the moment – maybe a project for future!
Best
Leonardo
Andreas, very interesting article.
I did the simulations using the data you provided and to get your results I had to go long when implied yield 3%, which is the opposite of what is written in the article. Long in contango and short in backwardation, which doesnt make much sense with the rest of the explanation.
Best
Daniel
(double post because of lower and greater than symbols)
Andreas, very interesting article.
I did the simulations using the data you provided and to get your results I had to go long when implied yield is lower than -3% and short when implied yield greater than 3%, which is the opposite of what is written in the article. Long in contango and short in backwardation, which doesnt make much sense with the rest of the explanation.
Best
Daniel
Andreas,
Congrats on a nicely written work. In your article you demonstrated that when futures is in contango, nearby month will drop towards spot, allowing a short position to profit from the roll yield, and vice versa for a backwardated market. I was wondering if there are conditions where the opposite is actually true, ie spot rise to meet futures in contango or decrease to match futures in backwardation market? I guess this seldom happens but in a deeply contango/backwardated market, there must be a time when spot peaked or bottomed, turning towards futures.
Andreas,
Following up on my thoughts re using this method of term structure analysis as a filter when trading spreads.
Looking at the Imp.Yld to c1 column column of the implied yields for OJ as shown in the article.
Looking at nothing but this data which would be the most favorable spread to trade?
a) Long OJF17-OJH17 b) Long OJF17-OJN17 c) something else
I picked the pairs with highest and lowest yield as I assumed one of those would be the preferred pair assuming the yield was > some threshold.
Want to make sure I understand the principles described in your article.
Thanks,
Robert