Almost all mutual funds in the world fail to do their job. You’ll find better odds at the racing track than you will buying mutual funds. So why do people still buy them?
Almost everyone in the developed world has a stake in a mutual fund. Even if you didn’t actively buy into any mutual fund, your pension fund is most likely invested in some of these vehicles. Mutual funds seem like a logical solution they have been hailed by governments, universities and banks as the perfect solution for individuals to participate in the equity markets.
The original idea behind mutual funds was very valid. In 1960.
The problem was that it took substantial money and work to obtain a general exposure to the equity markets. Without an index fund, it was difficult to buy a basket of stocks and invest in the overall market. Mutual funds solved that problem.
The mission of a mutual fund is not to make money per se. At least not for the investor. The fund is supposed to track a particular market index and attempt to surpass it. Each mutual fund has a very exactly defined benchmark index. It could be something as simple as the S&P 500 or something a little different like MSCI World All Share ex Japan, STOXX 600 Food and Beverage Sector Index.
A mutual fund’s job is to track its assigned index very closely. In reality this means buying almost exactly the same shares. The fund is given a tracking error budget, meaning that it’s not allowed to deviate from index more than the this TE budget.
The fund has costs to pay of course. There are fixed fees such as management fees and less visible ones like commissions. The total fees for a mutual fund is reported as the Total Expense Ratio (TER). It’s not cheap to run a mutual fund.
So how do you beat the index if you have to buy almost the exact same shares and still have plenty of costs to pay?
You don’t.
Almost no mutual fund manages to even match the benchmark return over any longer period. It’s always easy to throw generic statements like that around on the internet, so let’s see if we can’t find some data to back this up.
The S&P Indices versus Active Funds Scorecard report, aka SPIVA, tracks the performance of American mutual funds. The table below shows their report for 2013. It looks pretty much the same every year.
| Fund Category | Comparison Index | One Year (%) | Three Years (%) | Five Years (%) |
|---|---|---|---|---|
| All Domestic Equity Funds | S&P Composite 1500 | 46.05 | 77.53 | 60.93 |
| All Large-Cap Funds | S&P 500 | 55.80 | 79.95 | 72.72 |
| All Mid-Cap Funds | S&P MidCap 400 | 38.97 | 74.00 | 77.71 |
| All Small-Cap Funds | S&P SmallCap 600 | 68.09 | 87.32 | 66.77 |
| All Multi-Cap Funds | S&P Composite 1500 | 52.84 | 80.38 | 71.74 |
| Large-Cap Growth Funds | S&P 500 Growth | 42.63 | 79.78 | 66.67 |
| Large-Cap Core Funds | S&P 500 | 57.74 | 80.56 | 79.39 |
| Large-Cap Value Funds | S&P 500 Value | 66.56 | 76.75 | 70.26 |
| Mid-Cap Growth Funds | S&P MidCap 400 Growth | 36.72 | 79.37 | 86.19 |
| Mid-Cap Core Funds | S&P MidCap 400 | 43.48 | 67.27 | 83.94 |
| Mid-Cap Value Funds | S&P MidCap 400 Value | 45.33 | 73.97 | 67.14 |
| Small-Cap Growth Funds | S&P SmallCap 600 Growth | 55.61 | 86.10 | 69.60 |
| Small-Cap Core Funds | S&P SmallCap 600 | 77.70 | 91.10 | 74.73 |
| Small-Cap Value Funds | S&P SmallCap 600 Value | 78.99 | 88.00 | 60.74 |
| Multi-Cap Growth Funds | S&P Composite 1500 Growth | 38.14 | 86.54 | 68.56 |
| Multi-Cap Core Funds | S&P Composite 1500 | 62.74 | 84.51 | 77.15 |
| Multi-Cap Value Funds | S&P Composite 1500 Value | 49.21 | 70.68 | 67.98 |
| Real Estate Funds | S&P U.S. Real Estate Investment Trust | 50.00 | 86.71 | 80.28 |
Those percentages? They don’t show how many funds managed to do their job. They show the percentage of failure. Over a few years time, 75-90% of all mutual funds fail to do what they are supposed to do. They fail to beat their benchmark.
If almost all mutual funds fail to perform and if it can be proven so easily, why do people still invest in them? Why are there billions of dollars in mutual funds? Why to whales beach themselves?
If you want to have general equity exposure, mutual funds is the worst way to go. There’s a wide scale and many possible alternative. Most people are simply unaware of these alternatives. After all, the adviser at the bank told you that it’s prudent to invest in mutual funds. As long as it’s their own bank’s mutual funds of course.
In the next series of articles on this site, I’ll explain some alternatives to mutual funds. Some are better than others. They may not be what you think.
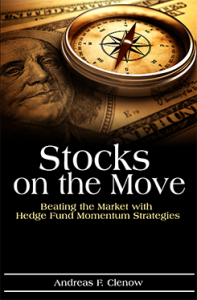
If you are suspicious of my sudden switch to articles about the stock market, you are absolutely right. I have a new book coming out soon. This time the topic is systematic equity momentum. Like with my first book, I will explain all the details and all the rules. There will be no trading systems for sale or other nonsense. It’s all in the book.
Of course, I won’t tell you the details now. Then you wouldn’t buy the book.
 Following the Trend


Yes! Nice one Andreas, I cannot wait to read it! Your first book was absolutely phenomenal and I’m always recommending it to people. I’m sure it will be fantastic, I hope the authors don’t pressure you to cut out the detailed sections like the year by year walkthrough you did in following the trend. I’m interested in how you avoid the data pitfalls you’ve outlined before and what level of concentration/Diversification you are going to describe as optimal. So excited for it.
Are you venturing into the realm of var-covar matrix estimation as an input to the portfolio risk allocation process?
All the best
George
Thanks, George! I hope you’ll like it.
The new book is very similar in style to the first one, but focusing on equity momentum instead of futures trend following. The year by year chapter will still be there, with plenty of trade charts and explanations.
I’m not going into covariance matrices though, for two reasons. First that you lose a large part of the readers by the time you say such words. More importantly though, covariance matrices aren’t very interesting when you deal only in stocks. They’re all massively correlated anyhow and the moment there’s some market scare, any difference seen before between the stocks goes right out the window.
Dear Andreas,
I’m sure I will!
You make a solid point about them with regard to stocks. On the point of var-covar in your first book,am I right in thinking you also excluded them for that same first reason of not wanting to confuse readers? From what I’ve found in a diversified universe of futures contracts over multi-decade periods, you get huge swings in the diversification benefit as the average pairwise correlation changes through the cycle [Page 182 in Greyserman and Kaminski’s book shows this best]. This throws off the accuracy of the simple (yet admittedly robust) ATR position sizing formula you used in the first book. Have you made use of portfolio volatility targeting approaches which take into account of cross-asset correlations in your own systems?
All the best,
George
Covariance models are a mixed sword, not to mention potentially as confusing as that metaphor.
You can use it to reduce corner risk exposures, but much of trend following returns actually come from corner risk. There are no clear cut answers here. If you reduce your models capability to take on concentration risk in some areas, you’ll inevitably also decrease long term profitability.
A more important improvement to make on a simple position approach like the one in my first book is rebalancing. That’s a critical point in reality, especially for medium to long term strategies. Vola isn’t constant, and you need to adjust your position sizes regularly.
Portfolio vola targeting is another double edged bag. It’s often popular among institutional investors and can thereby help you market your approach to larger clients. In general, I like vola targeting and I apply it to some strategies. Of course, you can’t do that effectively without fairly large asset bases. Vola targeting on a portfolio under 50 million dollars is just silly. You’d get a huge error factor.
Don’t confuse vola targeting with correlation/covariance approaches though. They’re different things, but can of course be used together.
Vola targeting is about measuring realized vola to target vola and rescaling all your sizes on a continuous basis, to ensure a realized yearly vola target.
Andreas,
I had a sob story like so many others until a recent ‘awakening’. I had my Australian retirement fund invested in an index linked fund up until a couple of years ago and the account balance only just recovered from the ’08 downturn. Since then, in frustration, I’ve studied investing and trading like a mad man, learnt how to back test (via Amibroker and a Premium data supply) and am now actively managing that same fund personally with expected results far above anything I could have gained from a mutual fund return.
Unfortunately due to certain restrictions around Australian retirement fund structures, I can only actively manage 80% of the balance but better than the alternatives and I’ve found myself slightly obsessed by strategy development and backtesting and am even taking early steps towards learning C#. This has had a unexpected side benefit in increasing my skillset for my current career in banking too so everyone is a winner.
Seriously looking forward to this new book and if your last one is anything to go by its going to be another benchmark.
Best of probability,
Simon
Can’t wait for the next book !
Great news Andreas. When will the book be out? Cant wait to get my hands on it. 🙂
I’m targeting a release in early July. I’ve got the proofs in my hand now and it should be ready quite soon.