Random risk can have it’s downsides.
Your trading model might have a random risk element and you might not even be aware of it. In particular longer term models need special care to avoid ending up with random risk.
The world doesn’t stop spinning when you open a position. The assumptions you used when opening your position may not be valid a week later. Even less so a month later. The world is dynamic and therefore your position sizes must also be.
When you read about ‘money management’, as changing position sizes is often referred to as, it’s mostly about how to double and half your sizes depending on your conviction or current gains. Classic methods involve doubling your position size once you have a certain amount of profits for instance, so called pyramiding up. I’ve always seen this type of thinking as more suitable for gambling than for professional trading.
Here’s a different way of looking at the classic methods of scaling position sizes based on past results. Let’s say you have a method of doubling your position size once you have a certain amount of gains on it. That way of thinking implies that your gains somehow have some predictive power about the future. Why would you want to double your risk just because you had a good run? Your gains or losses doesn’t affect the current market situation.
This is a common logical fallacy though. It’s same when you consider whether or not to exit a position. Say you’re long the Nasdaq and you’re considering whether to keep it or to close it. That decision is exactly the same as if you would have no position and consider whether or not to buy. Exactly the same. If you decide to keep your long position, but you wouldn’t buy on the current levels if you were not already in it, then you’re not acting rationally.
But, back to the topic of this article. This article is not about changing risk. It’s about attempting to keep it relatively constant. This is a much more common way to approach position sizes for professional strategies.
Time randomizes risk
I’ve written many times in the past on how to set position sizes based on volatility. There are many ways of doing that, but they aim at accomplishing more or less the same thing. The idea is to take on an approximate amount of portfolio level risk per position. You look at how much a market tends to move up or down in a normal day and size your position after that. Easy.
Setting an initial risk level of the position is easy. The problem comes soon after. What if the volatility of the position changes over time? You’d have a different risk than you intended. What if you have a large gain on the position? And, as often is forgotten, what if the position in question stays exactly the same, but your other positions in the portfolio changes?
Perhaps your position does pretty much nothing for a month, but at the same time you make large gains on other positions. Suddenly your portfolio as a whole is larger than when you opened your position. That means that the portfolio level risk of that position is now lower. Organic growth of the portfolio as a whole made the weight of this particular position smaller, even though it itself didn’t change.
As you can see, there can be many reasons why your risk will end up quite different from you had intended. Yes, dear institutional reader, the word I’m getting at is rebalancing.
Long term models require rebalancing
For institutional money managers, the word rebalancing is both common and clear. For retail traders, perhaps not. The idea is that you set your risk levels at one point, and then you recheck at regular intervals and reset the risks as you had initially intended.
This sounds boring, and it often is. It means making a whole bunch of trades that might seem odd and counter intuitive at the time. If you would see my trade blotter, you would wonder why I keep doing all these trades. You might ask why I’m selling in the middle of a massive bull market for instance. Perhaps if you looked at that blotter, you would think that I suddenly went bearish. No, not at all. I was just rebalancing. It had nothing to do with market views or trade signals.
Surely this is just a boring task that only institutional money managers have use for, right? Well.. it can actually greatly enhance your trading results, all while giving you a better control over your risk.
Let’s do a simple demo.
Remember the 12 months momentum model that I wrote about in the past? Let’s use that for the demo. It’s simple, it works, and it’s long term. That’s what we need.
The trading rules are:
- Check trade signals only on Fridays (to reduce whipsaws).
- If yesterday’s price is higher than 250 trading days ago, go long.
- If lower, go short.
- Use a simple ATR based position sizer.
- That’s it.
Now this model has an average holding period of around half a year. A lot can happen in that period. So let’s make two versions of this simple trend model. The first one is just as written above. Just that simple. The second model rebalances positions once a month. That means that once a month, we recalculate the position sizes and adjust current open positions to the size they would have if they would be opened just now. That is, we don’t just let the position sizes run wild and end up all over the place.
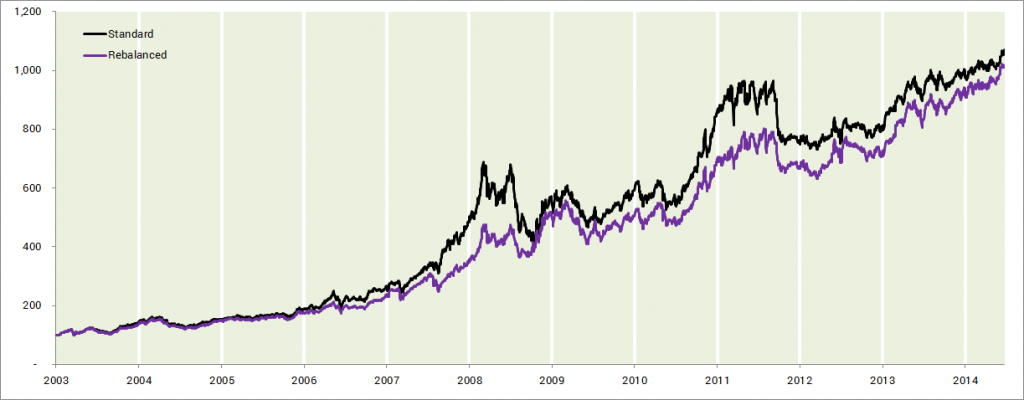
In the simulation results below, the two versions are compared. The standard line, in black, uses the same size throughout the position life time, while the purple line uses a monthly rebalance.
Well, it looks like the standard version won. Right? Hm.. perhaps not.
See how the standard version goes nuts at times? It has massive short term profits and ends up giving much of it away. The drawdowns are considerably steeper.
In this simulation, here are the key stats to look at:
- Both versions produced an annualized gain of about 23%.
- The standard version saw a max drawdown of 40%.
- The rebalanced version had a max drawdown of 25%.
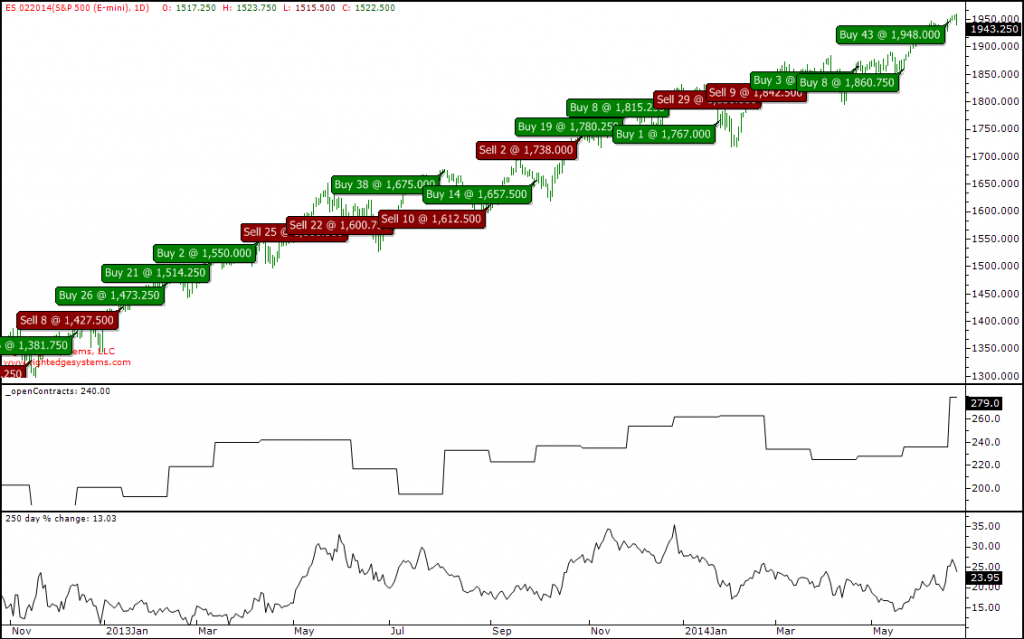
I mentioned above that you might find an actual trade blotter a bit confusing. If you didn’t realize that most trades are about risk rebalancing, you could spend days trying to figure out why all those trades are done. Take the S&P for instance. Trend followers have been long this for quite some time now. The model above has been long for several years actually. But it’s been more work than just buying a few years ago and sitting on it. Look at the trade chart below as an example…
None of these trades that you see in the chart above reflects any change in market view. The model is long and has remained so for a long time. But if we don’t do all of these small trades, the actual risk will drift far away from what the model intended.
Yes, reality can be a little bit more messy this way. But wait, it gets worse. The logic shown here still assumes zero fund flows. As an asset manager, and in particular a fund manager, you would see constant flows both in and out. Hopefully more in than out of course. If your fund has monthly dealing, you could expect to see money going both in and out every month. Each time, you’d have to adapt your position sizes to reflect the intended portfolio level risk. If you get a sudden inflow of 3% of the previous fund value, you’d in theory have to increase all positions by that amount. This may not always be possible of course, unless you’ve got a quite high AuM. For some reason, the exchanges don’t like it when you try to buy 0.6 gasoline futures contracts…
How exactly does one go about rebalancing a portfolio?
As I’m sure I’ve mentioned once or twice,
I started publishing a weekly futures analysis, covering about 75 different global markets. In this report, I detail how we approach each market at my asset management company, along with the quantitative analytics that we use. Every week I illustrate each market with a real life trading model to teach the ideas and methods of the industry.
Oh, and once a month I send out a deeper bonus document. This is different every month and contains something of interest to teach the subscribers something new. Last month’s bonus doc detailed two trading models based on a counter trend entry approach. Complete with full source code of course.
Next month’s bonus issue of the Clenow Futures Intelligence Report will focus on position size rebalancing. What can be done, why and how. Sign up for a free month trial and get next month’s issue.
Actually, sign up now and I’ll send you the last report with the counter trading models as well.
Sign up for a free trial here
 Following the Trend


If I understand rebalancing well, it means that I should decrease or increase a size of my open positions taken into account to my portfolio size, let us say every month. For instance, I started on 01/01/2014 with 1M USD and bought for example gold and natty risking 1% of a trading capital on each event (10K USD). Today, it is 01/31/2014 and my portfolio is 1,100,000.00 USD – I have made 99K USD on gold and 1K on natty, since I am risking less than 1% per trade now, I should sell both positions and then reopen them with a risk 11K USD on each one. Wouldn’t be easier just stay with opened positions and increase current positions?
There are several things that can impact your actual risk, and there are several ways to measure it. But no matter how you measure your risk, a few weeks into a position things will have changed.
I’m guessing that what you mean by risking one percent is that if the price falls to your stop, you lose one percent of your portfolio. I know that’s a common method used by many retail level trading software, but it’s very far from professional systematic trading. That method says nothing about vola and your daily variations, let alone about incremental risk to the current portfolio composition.
There are many inputs into most position sizing formulas, and most of those inputs will have changed soon after. So if you target X risk, whatever X might be in your way of looking at risk, a month later you will no longer have X risk. The difference could be big or it could be small.
If you were to recalculate the risk again a month later, you’d get a different number of contracts/shares. Rebalancing is about resetting your position size to the freshly calculated size at regular intervals.
Hi Andreas, just wanted to share some thoughts on pyramiding into a winning trade as I have been thinking of improving my returns. The way I look at it is this.
Imagine I use a trend following system and there is no way to know which trades are going to be the big winners and which are going to the small losers. We then incorporate a pyramid rule that incrementally raise position size only when a trade is doing well. The more favourable the trend is going, the more pyramids the trade will get (up to a certain level of risk, or number of pyramids, that is comfortable for the trader of course).
By design, this system should end up pyramiding into trades that turn out to be big winners and not pyramiding at all into losing trades that gets stopped out early. This system should naturally amplify returns while doing nothing for losing trades.
What are your thoughts on this?
Hi Andy,
I see what you mean, but I believe it’s another illusion. Your reasoning would imply that once a trade has done well for a period, it has a higher probability of doing well in the following period. If that was really so, you should hold off and just enter later in the trend.
What you’re likely to achieve is a method of wiping out the early profits fast on the first little pullback. With your increased risk, the inevitable pullbacks will be greatly amplified.
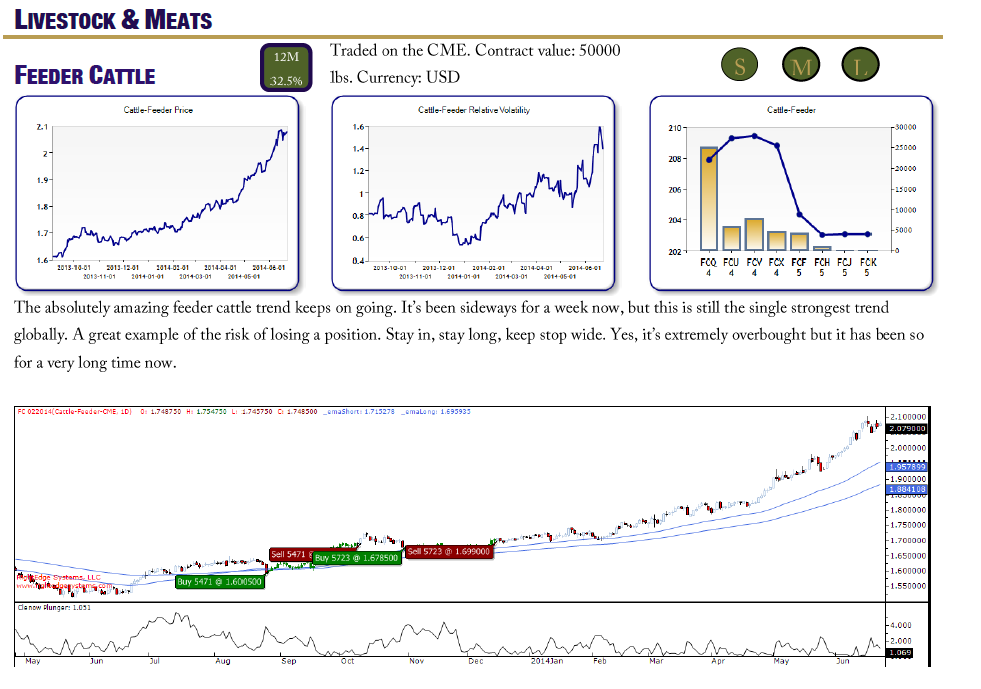
Or worse. Look at current situation in feeder cattle. It had an incredible trend up the whole year, but in the past week it suddenly had multiple limit down days. If you were in this trade the whole time, these limit down days aren’t very fun, but within acceptable parameters. If you had scaled up during the year, you would now have wiped out the whole year’s gains and probably more.
This whole way of thinking seems to me like the very opposite of risk management.
Totally agree with the part where typical trend following systems would still close the small winning trades at a profit, while one with pyramids would give up all the gains and even result in losses due to a small pull back.
I guess the key question is whether pyramids make big winners big enough to more than compensate for these losing trades. I certainly expect the performance of the system to be much more volatile, and this is as you said, the very opposite of risk management.
Thanks a lot for sharing your opinion on this.
There are many things in common retail trading lore that I disagree with. A few things just fail to make logical sense to me, while others are plain silly or even outright ridiculous.
I’d say that pyramiding falls into the first category. It’s not that it’s completely outrageously dumb. It’s not Elliot Wave kind of stupid. It’s just that I fail to see a logical or mathematical reason to do it.
Build your own trading models and isolate this factor to test it. Look at vola patterns, return distributions etc, on portfolio and position level. My own research on this has shown no positive effect of pyramiding, but I’d encourage you to do the math and see what you come up with. It takes a bit of work to structure the tests properly and to isolate this factor, but it’s not that difficult.
Let me know if you come up with anything interesting.
Salut Moniseur Clenow
Is rebalancing the samething as VaR,
because in your book you give as a riskmanagement tool 3*ATR and using a max 0.25% of the total asset value of the fund.
Because you mention in the book that proffesional fund managers use a VaR.
Rebalancing refers to the process of resetting your exposure to some desired level. Portfolio management is dynamic and you need to constantly rebalance to maintain a target risk level. It has nothing to do with VaR, which is a risk methodology.
Is it possible to write a article about Value at Risk because i bought a book on the subject, but the problem is that the book is very general but i want to focus my risk management strategy on diversified futures. And I want to head into the right direction.
It is my goal to start my own private (CFD) future asset management account and bought already the “Head First C# programming”
regards bart
Hello Andreas,
Even if we are not specifically speaking about risk methodologies, I would like to know how to assess risk, under VaR(if u use it?), with futures. I am quite puzzled with the technicalities using VaR on Futures, because of the discontinuous time series, do you model a constant maturity forward or you assess your VaR directly on continuous prices you have calculated before? The issue here as the VaR at least for parametric method, required a VarCov Matrix on Returns, so orignal prices are pretty much important else your VaR calculations might be misleading? Do yo have some solutions for that?
Thank you very much
Dave
Hi Dave,
All good questions, but far too complex to give even a decent overview in a comment field. For retail traders, there’s very little need for such solutions. For banks and hedge funds, well they can pay to get proper methodologies in place… 🙂
If you’re doing these things in large scale with a staff of portfolio managers and a large number of positions, you’ll likely need some very expensive risk tools. If you’re a single portfolio manager running a single portfolio, you likely have very good overview of your risk and you can construct whatever tools you need yourself without going into VaR stress testing etc.