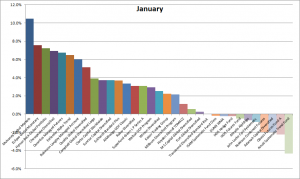
January was a very strong month for trend followers. Almost all funds are now far off their lows. Is this the big turn? Have we started the ascent to new highs? Perhaps. But don’t forget that in this business, we’re not attempting to forecast the future. We just follow a statistically sound method. We tilt the probabilities slightly in our favor and keep repeating. Over and over. In the long run, we’ll win.
In January most funds that reported so far are positive. Best was Mulvaney so far, although they do of course have some catching up to do. They are not strangers to steep drawdowns, but they always made it up in the past. Several other big funds had a great month too. Eclipse, Hyman Beck, Chesapeake, Quantica, Estlander etc.
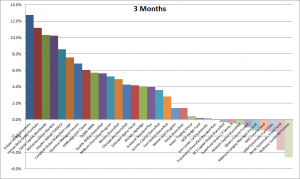
Looking at a little longer time periods, we can also see the pattern. The industry as a whole has been turning upwards and is making up for the losses. Not many funds still have meaningful losses in a three months window.
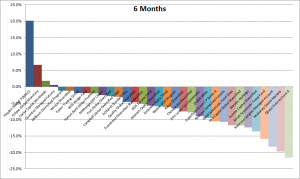
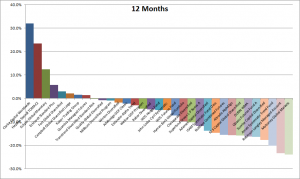
Of course, if you move to a 6 or 12 month horizon, the industry still has some losses to make up for. What we’ve seen for the past two years is the longest period of drawdowns for the trend following industry so far. The level of the losses was on average slightly more than previously seen as well. It’s a sign that trend following is becoming more difficult. But hardly a sign of the end. Steep drawdowns is one of the downsides with this strategy. It’s well known and something hard to look away from. But every time in history so far, the diversified trend followers have not only made up for their losses. They have also outperformed any traditional investment strategy. On a risk adjusted basis. With lower drawdowns.
| Name | January | 3 Months | 6 Months | 12 Months |
|---|---|---|---|---|
| Clarke Capital Worldwide | 3.7 | 10.3 | 1.8 | 32.0 |
| Heyden Steindl TOMAC2 | 1.1 | 8.6 | 20.1 | 23.5 |
| Eclipse Global Monetary | 7.5 | 12.7 | 6.6 | 12.4 |
| Eckhardt Standard Plus | 3.7 | 4.0 | -4.7 | 5.7 |
| Fort Global Diversified | 0.3 | 2.8 | -2.9 | 3.0 |
| Campbell Global Diversified Large | 3.9 | 7.6 | -3.1 | 2.2 |
| Kaiser Trading Group | 2.2 | 0.4 | -1.9 | 1.5 |
| Quantica Managed Futures | 6.7 | 6.8 | 0.6 | 1.5 |
| Transtrend Diversified Standard Risk | 0.0 | -0.1 | -5.3 | -0.2 |
| Quality Global Diversified | 5.1 | 5.6 | -4.7 | -0.8 |
| Millburn Diversified Program | 2.1 | 5.2 | -1.2 | -0.9 |
| Winton Diversified | 2.5 | 4.9 | -1.3 | -1.8 |
| AIMhedge GDF Classic | 3.4 | 6.0 | -2.5 | -2.2 |
| Estlander Alpha Trend | 6.5 | 4.2 | -6.2 | -2.9 |
| Welton GDP Program | 2.9 | 1.4 | -6.6 | -4.4 |
| Rabar Diversified | 3.1 | 1.4 | -7.6 | -4.6 |
| IKOS Hedge Fund | -0.2 | 0.2 | -2.0 | -5.0 |
| John Locke Cyril Systematic | -0.9 | 0.2 | -8.9 | -5.0 |
| IKOS Futures Fund | -0.5 | -1.3 | -5.7 | -7.3 |
| Hyman Beck Global Portfolio | 7.2 | 11.2 | -2.1 | -9.7 |
| Chesapeake Diversified | 6.9 | 4.3 | -7.9 | -10.2 |
| Superfund Green L P Series A | 3.1 | -0.4 | -10.6 | -11.8 |
| Adamah Capital Diversified | -2.0 | -0.6 | -6.0 | -13.9 |
| ISAM Systematic Fund Class | -0.2 | -1.5 | -11.8 | -14.6 |
| NuWave Combined Futures | -2.0 | -4.6 | -10.8 | -15.6 |
| Altradis AlphAlgo | -0.7 | 4.1 | -12.3 | -15.7 |
| M S Capital Global Diversified | 0.6 | -0.3 | -11.8 | -15.9 |
| DUNN WMA | -0.2 | 5.7 | -9.5 | -16.2 |
| Qbasis Futures Fund A | -2.2 | -1.0 | -21.7 | -16.4 |
| Sunrise Capital Diversified | 3.7 | 3.6 | -13.6 | -17.7 |
| Amati Systematic Trend Fund | -4.3 | -3.7 | -15.9 | -20.1 |
| Robinson Langley Managed Account | 6.0 | -1.3 | -18.3 | -23.3 |
| Mulvaney Global Markets | 10.5 | 10.2 | -19.8 | -23.9 |
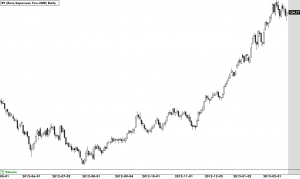
There has been several interesting trends responsible for the turnaround in futures funds. Most important of them is the currencies. Anything related to the Euro of the Yen has had huge gains. Best of course, is the cross between the two. Just look at this chart of the RYH3 (Euro/Yen).
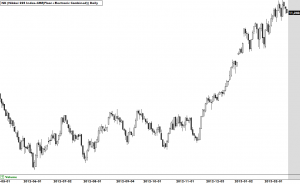
Naturally the equities rally has helped as well. But equities are by far the most problematic sector for trend followers. It’s the least profitable and the most volatile. For now they are in our favor. But be careful with this sector.
The most interesting trade in this sector is of course very closely related to the trade above. One might actually claim that it’s the same trade. Look at the Nikkei chart here.
Meanwhile the bonds continue to suffer. Many trend followers are now net short bonds. That’s unusual. Yields have been going down for decades. This has been excellent for us. But that game is over and that’s a large reason why trend following is becoming more difficult.
I apologize for the low frequency of updates on this site recently. I’ve been busy, not only trading my own fund and managed accounts, but also with starting TradersPlace.net. We’re hoping to build a serious trading site where professionals can meet, network and share ideas. If you haven’t seen it yet, please head over to TradersPlace.net and sign up. It’s completely free of course.
 Following the Trend
