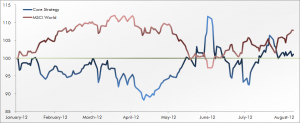
It’s been a rocky year for trend followers so far and our core strategy is just barely above zero for the year. July was very good and so far all CTA funds I follow came in with strong numbers, as could be expected and predicted by the core strategy. Early in the year the trend followers as a group were far behind the equity buy and hold crowd but recently the race got close again. To be sure, CTA traders had a higher volatility and much deeper draw downs during the year, so we are still playing catch-up here. What we are seeing this year is by no means an anomaly but rather just business as usual. Most of the time, this is how things works in our industry. You struggle with high volatility and being behind the bench, and then suddenly those nice trending periods come around and we outperform everything in sight. Over the long run, we win.
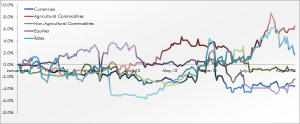
If we break the performance down on sectors, we can see a few interesting things. For starters, the overall strategy recovery since the bottom in April has been primarily driven by the long rates sector. The trades driving this has been long bonds across all maturities in Germany, the US and the UK. The risk held in this sector has been quite large, especially given the very high internal correlation seen in that sector this year. When they go up, they all go up, and when they turn down, they all turn down. This is what happened a couple of weeks ago as you can see. The light blue line representing the rates sector went down as there was a general correction move in that market. The trends in rates is still bullish but correlations are increasing and the yields are approaching zero. The trade might work a bit longer but there will be a limit to this action sooner or later.
The other interesting sector lately has been the agriculturals. In this sector, the grains took off big time when the drought hit the US farmers. It created large profits for us in a very short amount of time before the correction came in to stop out part of our positions. We still hold medium size bets on a continued bullish move in grains even though the correction reduced them a little. The remaining sectors have been remarkably quiet lately.
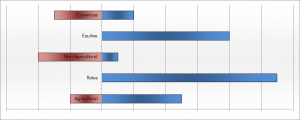
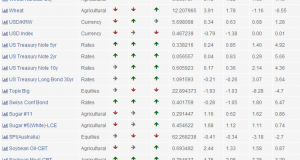
Recently the core trend following strategy has been increasing bullish tilt, in several ways. It has taken on direct long equity index futures, it started reducing the long bonds and it has slightly reduced long dollar bets. What we are left with at this point is a fairly balanced portfolio. There is no large bias to a bullish or bearish equity/economy scenario anymore. Depending on what happens next in global politics etc., the portfolio will likely take a clear stand in either camp but for now it remains balanced.
| Market | Direction | Sector | Entry Date |
|---|---|---|---|
| Lumber | Long | Agricultural Commodities | 2012-07-10 |
| Hogs-Lean | Short | Agricultural Commodities | 2012-08-06 |
| Oats | Long | Agricultural Commodities | 2012-07-05 |
| Wheat | Long | Agricultural Commodities | 2012-07-02 |
| Azuki Beans-Red | Long | Agricultural Commodities | 2012-06-13 |
| Rubber | Short | Agricultural Commodities | 2012-05-10 |
| Corn | Long | Agricultural Commodities | 2012-07-03 |
| New Zealand Dollar | Long | Currencies | 2012-08-01 |
| Swiss Franc | Short | Currencies | 2012-05-15 |
| British Pound | Short | Currencies | 2012-06-06 |
| Australian Dollar | Long | Currencies | 2012-07-30 |
| Euro | Short | Currencies | 2012-05-10 |
| S&P 500 | Long | Equities | 2012-07-20 |
| FTSE 100 Index | Long | Equities | 2012-08-02 |
| DJ Euro STOXX 50 Index | Long | Equities | 2012-08-08 |
| Dax Index | Long | Equities | 2012-08-01 |
| CAC 40 Index | Long | Equities | 2012-07-30 |
| SPI 200 Index | Long | Equities | 2012-08-08 |
| Hang Seng Index-HKEX | Long | Equities | 2012-08-07 |
| Nasdaq 100 Index | Long | Equities | 2012-07-20 |
| Palladium | Short | Non-Agricultural Commodities | 2012-04-05 |
| Gasoline-Reformulated Blendstock | Long | Non-Agricultural Commodities | 2012-08-08 |
| CopperHG-COMEX | Short | Non-Agricultural Commodities | 2012-05-15 |
| Platinum | Short | Non-Agricultural Commodities | 2012-07-25 |
| Silver-COMEX | Short | Non-Agricultural Commodities | 2012-04-05 |
| T-Note-U.S. 2 Yr | Long | Rates | 2012-04-19 |
| T-Bond-U.S. | Long | Rates | 2012-04-24 |
| T-Note-U.S. 10 Yr | Long | Rates | 2012-04-17 |
| EURIBOR-3 Mth | Long | Rates | 2012-01-23 |
| Japanese 10yr Govt Bond | Long | Rates | 2012-04-12 |
| T-Note-U.S. 5 Yr | Long | Rates | 2012-04-20 |
| Gilt-Long(8.75-13yr) | Long | Rates | 2012-04-11 |
| Euro German Schatz | Long | Rates | 2012-07-12 |
| Eurodollar-3 Mth | Long | Rates | 2012-06-19 |
| Euro German Bobl | Long | Rates | 2012-07-09 |
| Sterling Rate-3Mth | Long | Rates | 2012-05-31 |
Most of the big name CTA funds are tracking our core strategy quite well. The ones that already came in with their July results are showing strong numbers as expected. If you want to track these funds closer than the core strategy here, you need to adapt one of three variables. Either change the investment universe to tilt the sector allocation closer to a specific fund or change the time frame by adjusting the entry point or stop point, or change the risk factor by adjusting the trade size. A small number of CTA funds are really tough to reverse engineer and track but most of them can be figured out by taking the core strategy used on this website and adjusting the mentioned variables. Following the Trend is now available for pre-order on Amazon.
| Manager | Product | Jul | YTD | CAROR | WDD |
|---|---|---|---|---|---|
| Abraham Trading Company | Diversified Program | 4.70% | 0.18% | 18.38% | -31.96% |
| AIMhedge Management Ltd. | AIMhedge GDF Classic EUR | 0.76% | 0.44% | 10.75% | -20.21% |
| Blackwater Capital Management | Global Program | -2.27% | 14.30% | -18.26% | |
| Campbell & Company | Global Diversified Large | 5.20% | 8.53% | 8.97% | -29.50% |
| Chesapeake Capital | Diversified | 5.85% | -4.60% | 12.40% | -30.62% |
| Clarke Capital Management | Worldwide | 8.95% | 27.36% | 15.10% | -27.15% |
| Conquest Capital Group | Conquest Managed Futures Select | -4.06% | 4.80% | -22.06% | |
| Drury Capital | Diversified Trend-Following Program | -0.31% | 11.77% | -32.52% | |
| DUNN Capital Management | World Monetary and Agriculture Program | 4.53% | -10.29% | 14.04% | -57.66% |
| Eckhardt Trading Company | Standard Plus | 3.16% | 20.41% | -40.39% | |
| Eclipse Capital Management | Global Monetary | 4.85% | 8.17% | 9.06% | -25.95% |
| Estlander & Partners | Alpha Trend | -0.11% | 11.82% | -18.12% | |
| FORT LP | Fort Global Diversified | 8.70% | 10.54% | 18.25% | -26.55% |
| Heyden & Steindl GmbH | TOMAC2 | 4.08% | 19.94% | -42.20% | |
| Hyman Beck and Company | Global Portfolio | 3.67% | -11.96% | 10.31% | -29.27% |
| IKOS | The IKOS Hedge Fund | 1.59% | -3.56% | 9.76% | -12.16% |
| IKOS | IKOS Futures Fund | 4.03% | -2.37% | 8.92% | -12.76% |
| ISAM | ISAM Systematic Fund Class A (USD) | 4.12% | -6.74% | 14.39% | -21.64% |
| John Locke Investments | Cyril Systematic Program | 6.40% | 3.32% | 6.84% | -13.76% |
| John W. Henry & Company | Global Analytics Program | 5.06% | -24.32% | 8.24% | -43.64% |
| Kaiser Trading Group | Kaiser Trading Group | 0.32% | 2.91% | 9.12% | -10.01% |
| Millburn Corporation | Multi-Markets Program | -7.96% | 8.08% | -15.54% | |
| Mulvaney Capital Management | The Mulvaney Global Markets Fund, Ltd | -18.08% | 13.48% | -41.28% | |
| NuWave Investment Management, LLC | Combined Futures Portfolio, Ltd. | -6.88% | 12.33% | -16.97% | |
| Qbasis Fund Management | Qbasis MF Trend Plus (Proprietary) | -1.13% | 21.16% | -39.56% | |
| Qbasis Fund Management | Qbasis Futures Fund A | -1.13% | 6.78% | -39.42% | |
| Quality Capital Management | Global Diversified Programme | 6.85% | 6.88% | 12.85% | -23.73% |
| Quantica Capital AG | Quantica Managed Futures | 4.31% | 1.46% | 10.71% | -9.85% |
| Quest Partners, LLC. | AlphaQuest Original Program | 2.94% | 13.15% | -24.60% | |
| Rabar Market Research | Diversified Program | 2.73% | 4.07% | 12.77% | -29.82% |
| Sunrise Capital Partners | Sunrise Capital Diversified, Ltd. | -6.33% | 7.65% | -20.30% | |
| Superfund Group | Superfund Green L.P. Series A | 2.58% | -0.79% | 2.67% | -38.07% |
| Transtrend B.V. | Diversified Trend Program – Standard Risk | 3.00% | 9.75% | -10.92% | |
| Welton Investment Corp | GDP Program | 5.27% | 1.21% | 8.64% | -21.54% |
| Winton Capital Management | Diversified | -4.11% | 15.30% | -25.59% |
 Following the Trend


