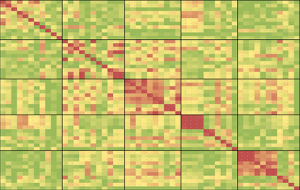
 They key to trend following is to be very diversified, so that your return curve moves up in a reasonably smooth manner. What you need to ask yourself however is whether you are holding a real diversified portfolio or just a very expensive illusion of safety. Everyone talks of increasing correlations the new risk on/risk off world, but few topics are as misunderstood and misused as this one. I’ll try to clear up some of the questions in this tutorial on how to measure and analyze correlations for cross asset futures.
Never Calculate Correlations Based on Prices
The most common rookie mistake is to calculate correlations based on price levels directly. For simple examples it may seem that the numbers make sense and don’t differ much from using returns, but there is an error factor present which may grow significant in some cases. By using absolute price levels as basis for the correlations you are implying that there may be a connection between the price levels themselves across instruments and asses classes, instead of the relative changes in them. As long as the price moves in your series are very evenly distributed you’ll get very close numbers but by using the absolute price levels as your basis, you are putting a very high weight on the earlier numbers in the series and that is probably something you don’t want to do. The oldest return in an N-period data series contributes N times as much to the correlation result as the newest return in the set and that leaves you with nonsense data for our purposes.
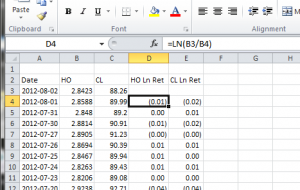 Use Log Returns as your Basis
Instead of using absolute price levels, you should use log returns. You could argue that using simple percentage returns gives close enough results, but if you’re going to do it, let’s do it right. The log returns between two consecutive days is simply calculated as ln(P2/P1), where P1 is the price on the first day and P2 the price on the second day. By normalizing your data series this way before making any correlation calculations you’ll get outputs that make a whole lot more sense.
Different Trade Times Can Distort the Picture
If you are only interested in instruments on the same exchange or at least on exchanges with the same closing time, things are so much easier. You simply cannot compare the closing prices for each calendar day across multiple regions of the world, as they represent the closing price of very different times of that day. When the Hang Seng futures close the European futures are just starting trading and the Americans are not even awake yet. A surprise move in the S&P would likely have an impact the next day on the Asian markets, but this would be lost if you use one day return calculations and it would seem as if the moves are not related.
The simple and most common solution is to calculate returns based on several days, effectively diluting this time difference effect. If you for instance calculate the returns as ln(P10/1) and thereby use a ten day return as your basis, you will find that the resulting correlations are much more accurate.
Calculating the Correlations
Correlation calculations are very straight forward and once you have the correct data to base it on, as described above, you can use a normal correlation formula. The one built into Excel works just fine in case you want to work in that environment. What you need to do is to calculate the log returns for all your instruments and then make a big table of correlations between them all. In case you want to read up on the basics of correlations, Wikipedia as usual has an overview.
The correlation number will be between -1 and +1 where the lower extreme means that the series move perfectly opposite, zero that they are completely independent and one if they move perfectly in sync. For our purposes though, it makes little sense to use negative numbers. With trend following futures trading systems, you will never be long two instruments with strong negative correlations or vice versa, that’s just part of how the strategy works.
What we are interested in is primarily to find out where the risk concentrations might be, i.e. which markets have a very high correlation at the moment. If the correlation is negative or positive matters little. In a strong bear market, equities are likely trending down while bonds are trending up. The two asset classes will likely show a high negative correlation. But since we are then with very high probability long bonds and short equities, all that matters is that the correlations are high and not the plus or minus sign. Therefore, it makes sense to only look at absolute correlations.
Output Matrix
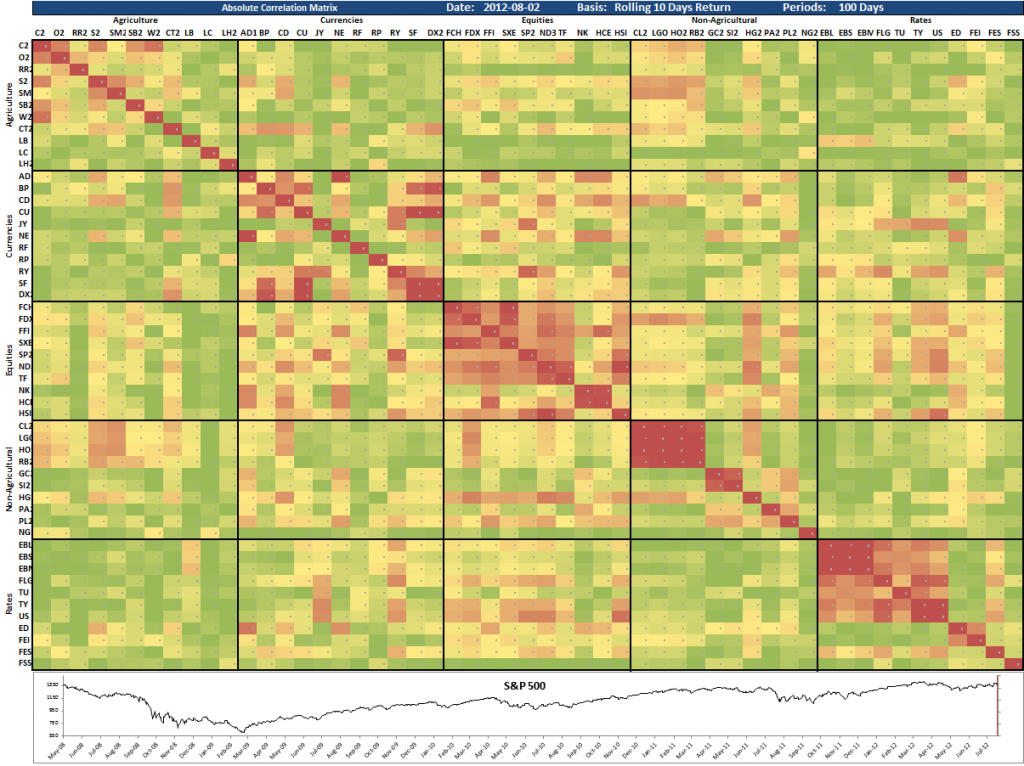
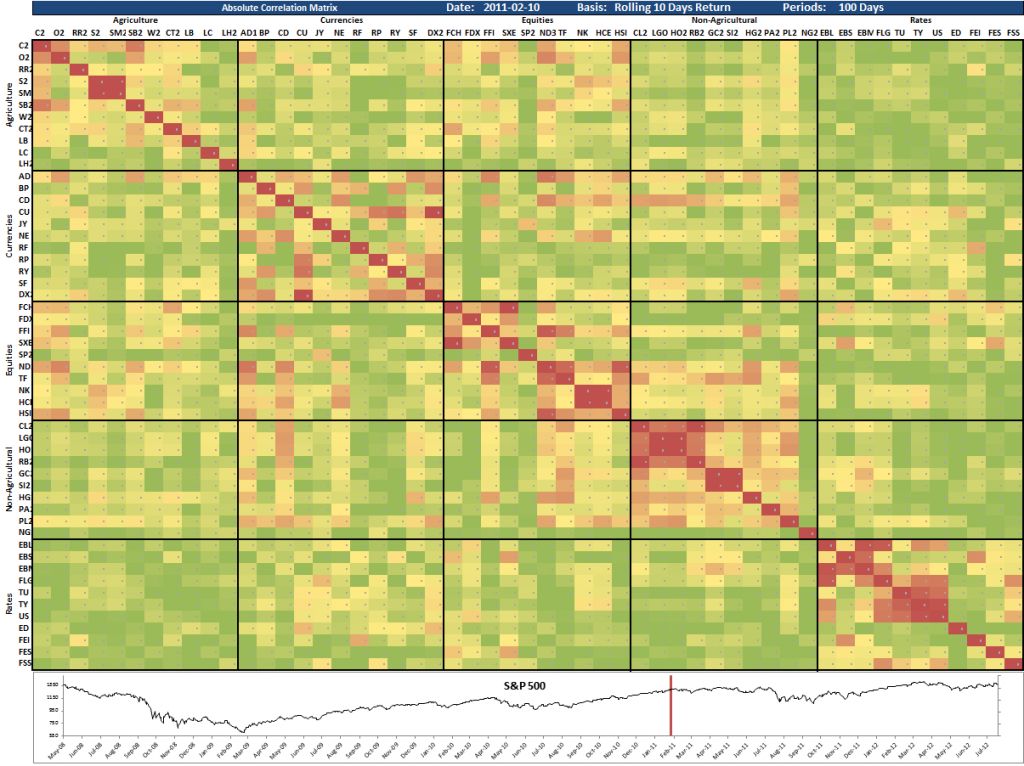
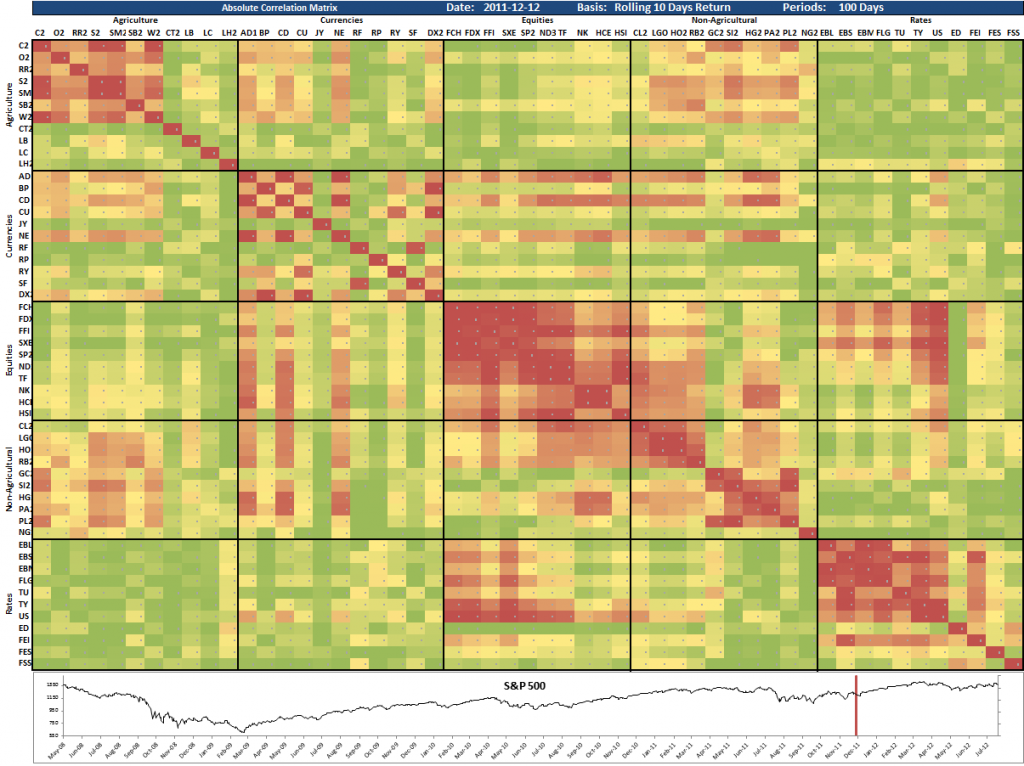
Since we are usually dealing with a large number of instruments when trading futures, it will be easier to read if you group them in a logical manner. In this case, I have grouped the instruments on sectors and made borders around each sector. I’ve also color coded the output and hidden the actual numbers to help get a quick overview of where the concentrations may be. To help get a historical perspective, I’ve also added the S&P 500 index below, showing with a red line where we are at the moment.
The first matrix here is as of August 2, 2012. It tells us that the equity sector has quite a high internal correlation, but this is not something that should surprise anyone. The correlation within this sector is almost always higher than in any other sector and the current level is not historically high.
We can also see that the oil based energy markets have an extremely high correlation at the moment. If you have positions in all of them, you essentially have one big position. The same goes for the bond futures where the correlations are much higher than normal. Be careful if you are heavily long bonds. It may very well continue up, but if it does not you stand to lose on all of them at the same time.
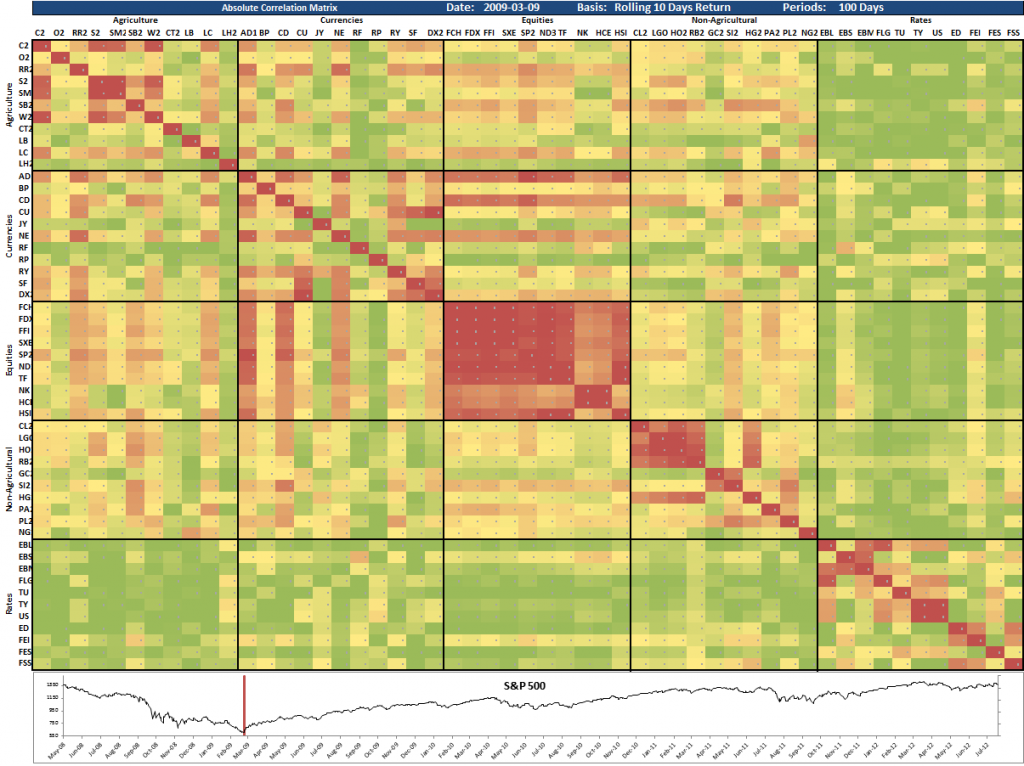
Just to put this matrix into context, let’s show a few older ones to compare with.
Happy Correlating!
 Following the Trend



Hello Andreas, What software are you using for your matrix and Log returns table?
It sure looks impressive
Thank you kindly
This is just Excel, John. All math done in Excel functions and simple conditional coloring applied on the cells in the matrix.
hi Andreas, why do you measure 100 days period for correlation? why not pick different number?
It’s just an example. No need to hard code a number. Just make it flexible and set it to whatever makes sense for your application.
Hi,
I’m wondering if you considered using ratio adjusted futures for calculating ln [Ref(C,-10days) / C], and ultimately the correlation derived from that series.
Having point adjusted futures would appear to me that the percentage relation is surely lost over time (10years++), hence the correlation calculated may be not correct, would you be so kind an elaborate on the background?
thanks for your time.
Correct. For longer term analysis, you would need a ratio adjustment.
Hi Andreas,
I see that you are using log returns of individual futures price to see if there are correlated. it is pretty logical for trend following systems if the trades are going for many days.
May i know how do you compare system to system? Let say trend following vs counter trend or even trend following method 1 vs trend following method 2?
I am using log returns of their equity returns for each trading system.
Is it a good gauge for the correlation between systems or there are better methods you are able to suggest?
If you’re looking to do correlation type studies, log returns would be your best choice. It also makes it easier work with the data of course, due to the properties of log series. Additive returns etc.
Thanks for the info Andreas. Are there any books/research papers which talk about even portfolio allocation between instruments that are closely correlated? Is there a formula for this?
Hi Andreas,
Thank you for such a detailed presentation. It is immensely helpful. I want to double-check with you: do you calculate log rolling returns over 10 days for asset A and asset B, and then calculate the correlation between these returns over a 100-day period? Is this correct?
And do you colour-code in red when the correlations are high, and in green when low?
Thank you so much!
Correct all all accounts. I usually also work with absolute correlations, since both extremely high positive and extremely high negative correlation is a problem.
Hi Andreas,
Thank you very much for your reply. Just a couple of follow-up questions: using 10-day returns introduces a time lag, isn’t it better to use a shorter timeframe (5 days or even daily returns) to spot emerging macro trends? And does it matter much if a shorter period is used to calculate correlations?
Much appreciated!
It all depends on your purpose. There’s no better or worse, any more than a hammer is better than a screwdriver.
Andreas,
Thank you very much for taking your time to help me out. I am truly grateful. Before, I never looked at cross-correlations, I am amazed how illuminating these numbers are. Warmest regards and best wishes!
Great article!
For the part: calculate the log returns for all your instruments and then make a big table of correlations between them all
Can you go into more detail? Do you just use =correl(array1,array2) for each of the pair of ln returns? or can you use the data analysis correlation matrix maker since it is faster?
What if I want to make a live flexible/dynamic(?) correlation matrix where i can change the date ranges (all 60 days of data or just the 1st 10 days or middle 20 days, etc.)? (so not using the data analysis tool). How can I make a formula that references the changing date ranges for a correlation matrix?
Thanks!
Making a dynamic correlation matrix in Excel is easy. It’s all in the article really.
You can use the Excel function Offset() to make calculations dynamic, based on input cells. Pull in the actual data, calculate log returns with an optional smoothing factor, do the correl() function on the logs.
I haven’t looked at this article for a few years, and I find it amazing that in four years, no one has pointed out the typo ‘asses’ in there. I think I’ll just leave it in there, since no one noticed anyhow…
How would you do an overall correlation on this matrix?
how would you calculate the “average correlation” across the entire matrix in excel? Thanks Andreas.