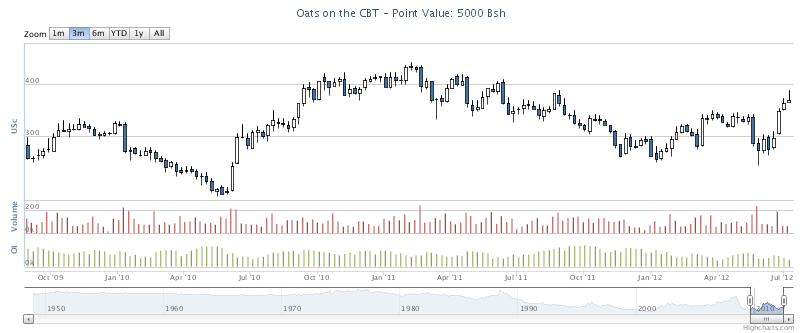
When you deal with futures trend following it is imperative that you have properly adjusted time series to analyze or you will not get any meaningful results. Our new interactive futures charts are of course fully adjusted and covering all asset classes and all major instruments. Did you ever want to analyze the long term performance of live cattle? How about rubber, oats, yen, Bund or the SP500? We got them all.
Go have a look at our interactive trend following futures trading charts!
Read more about why you need to adjust your charts for proper trend following trading analysis.
 Following the Trend


One comment
Pingback: Reading Futures Trading Charts